The sun is out and the frost is melting... This is usually the period of time where the real estate market generally loosens up and picks up in transactions (purchases and sales) and listings (product). It is of note that the same headlines (regarding supply) ring the same from last year's to this:
 February blog which can be found here) and that trend will likely continue. The tricky part is finding the actual bottom and when it does turn around will they be late? In fact some areas had an increase in list-to-sale ratio from the balanced market they were experiencing, have those areas already gone through their reduced price time?
"Home sales down, listings up across Metro Vancouver" - Real Estate Board of Greater Vancouver (REBGV), 2018
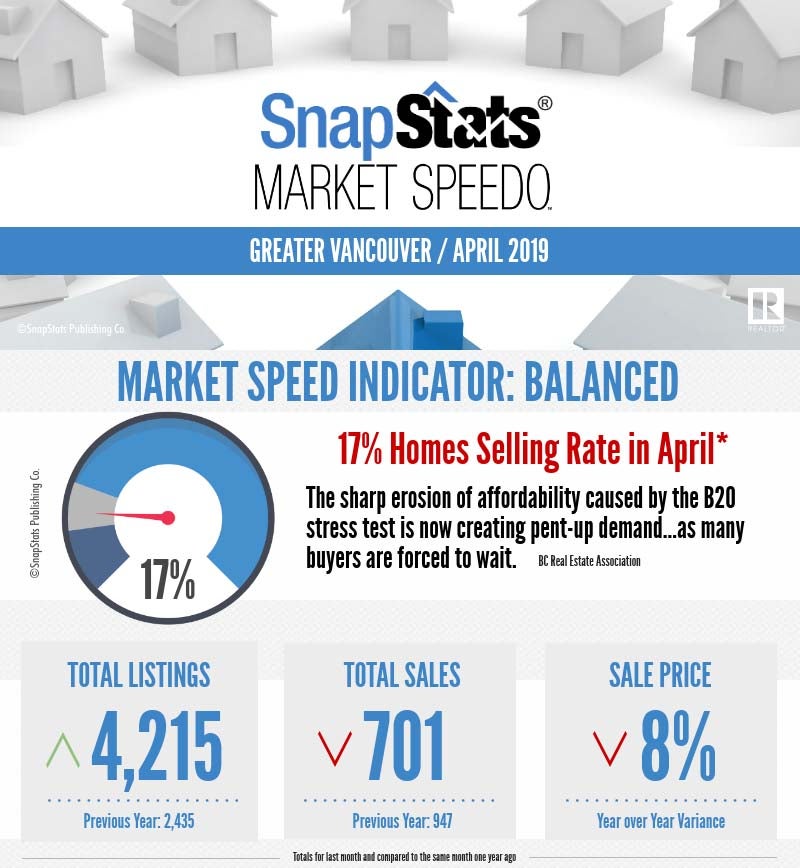
"Reduced demand and increased supply remain the trend across Metro Vancouver's housing market" - Real Estate Board of Greater Vancouver (REBGV), 2019
While stats can always be narrowed down to target a certain area in particular (please don't hesitate to ask for some specific to your area for a stronger analysis) the overall market sales-to-list ratio maintains at 17% across Greater Vancouver from the previous month; which is considered a balanced market by analysts.
The culprit for this increased supply of homes with lack of demand is the "stress test" that was rolled out by the government to aid in the cooling of the market (which seems to be doing exactly what they said it would). It has however reduced the buying power of purchasers by approximately 20% according to the REBGV President, Ashley Smith. This lower buying power causes significantly more struggle for those that are at the entry-level (read: first-time buyers) of the market to secure financing and thus pushes them out of the market altogether. This also has an effect on all purchasers as they must qualify for a higher interest rate than the current one posted in the 3.2X% - 3.4X% range for which those that are selling have to adjust for.
So what does this all mean? Open houses seem to be quite busy from most accounts in the industry and MLS searches seem to be high, which shows that there are still a lot of buyers looking and a lot of supply for them to look at. I am of the opinion that with the downward pressure on prices there are a lot of buyers still waiting on the bottom of the market (as stated in my
February blog which can be found here) and that trend will likely continue. The tricky part is finding the actual bottom and when it does turn around will they be late? In fact some areas had an increase in list-to-sale ratio from the balanced market they were experiencing, have those areas already gone through their reduced price time?Overall, if a purchaser has managed to secure financing though, this is a pretty good time for them. Listings are coming on the market daily and demand being lower than the average of the past 10 years, there is time for negotiations and breathing room to really take a look at a property (over the breakneck speeds that was happening a couple of years ago).
Those that are selling will need to be very sharp on their pricing so as to not risk "chasing the market"; as with any time selling pricing correctly and reasonably is a main key, but with more supply than usual the days of tossing a sign up and collecting a ridiculous amount of multiple offers are over. Now is the time of analysis and pricing in the actual range to sell. This downward pressure will likely continue into the summer months as traditionally the market slows down for transactions as well (which we are already seeing in the typically busier Spring months), unfortunately I have no crystal ball so we will have to wait and see.
If you would like a more in depth look at a certain area, would like more statistics or have any questions please don’t hesitate to contact me at haze-hartwig@coldwellbanker.ca