Sales for the year in the Greater Vancouver Regional District (GVRD) totaled 30,944. This is a 22.1% increase from the final tally in 2019; however last year’s total was 2.8% below the 10-year average. Overall GVRD fared relatively well though out the pandemic and the market coming to a dead stop in March when it first reared its ugly head.
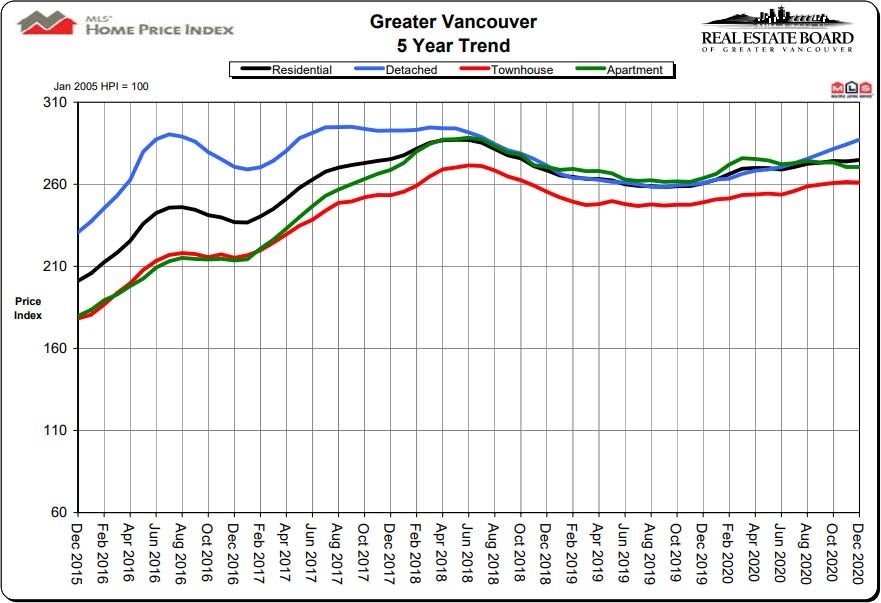
2020 had a total of 54,305 homes listed, which was a 4.6% increase from 2019 and had a 5.9% increase in the total benchmark price of all types of residential properties combined.
The break down in each type of property was as follows:
2020 had a total of 54,305 homes listed, which was a 4.6% increase from 2019 and had a 5.9% increase in the total benchmark price of all types of residential properties combined.
The break down in each type of property was as follows:
Apartments up 2.6%
Townhouses up 4.9%
Houses up 10.2%
--
The December market update and stats show that the total number of homes sold was up 0.9% from the total in November of 2020 and was equal to 3,093.
The higher sales in the later months were likely caused by unusual seasonal traits brought on by the Covid-19 outbreak along with the extremely low interest rates brought in from the Bank of Canada.
For all property types, the sales-to-active listings ratio for December 2020 is 36.2% and by property type, breaks down as follows:
35.2% detached homes
50.4% townhomes
33.1% apartments.
Generally, analysts say downward pressure on home prices occurs when the ratio dips below 12% for a sustained period, while home prices often experience upward pressure when it surpasses 20% over several months. For our uses of these numbers all home types will likely be seeing increases in prices (especially in the townhome type) should these number remain.
The current months of inventory (MOI) are quite low and break down as follows:

Apartments – 3.4 MOI
Townhomes – 1.6 MOI
Houses – 1.9 MOI
The reasons that months of inventory are important are that when there is are low months of inventory it will better show the type of market for each selected type of property. The lower the MOI the less likely a seller will need to negotiate.
An average MOI between 5 and 6 months is considered a balanced market. Below 5 months is a seller’s market and above 6 is a buyer’s market. Needless to say you can see that we are in a seller’s market and most definitely in one for both townhomes and detached houses respectively.
Benchmarks prices from November held to relatively modest increases and were as follows:
Apartments – Unchanged
Townhouses – Down 0.1%
Houses – 1.0%
The take away:
We are having quite a bit of low inventory which usually results in upward pressure on prices. Now many think “oh I am looking for an apartment so what do I care about what a house or a townhouse market is doing?”
The housing market is in fact related to each other in the sense that if a purchaser is looking for a 2 bedroom townhouse for instance and they are in fierce competition for that and getting pushed out of the market, they will start to look towards 2 bedroom apartments as they will likely be a bigger fish in a smaller pond as far as available resources to purchase. This in turn will affect the apartment market.
With the currently low interest rates, low inventory and typically a busier market in the spring, predictions of price increases I don’t believe are farfetched. Time will tell and with the BC Real Estate Association forecasting a 2.6% increase, they may not be out of line. Time of course will tell…
If you would like a more targeted analysis for your particular area or needs, please feel free to contact me via phone at 604-522-4777 or e-mail directly at haze-hartwig@coldwellbanker.ca or join us at our Facebook Page (www.facebook.com/HazeRealty)
Source: Real Estate Board of Greater Vancouver – Nov 2020 Stats (http://members.rebgv.org/news/REBGV-Stats-Pkg-December-2020.pdf)
50.4% townhomes
33.1% apartments.
Generally, analysts say downward pressure on home prices occurs when the ratio dips below 12% for a sustained period, while home prices often experience upward pressure when it surpasses 20% over several months. For our uses of these numbers all home types will likely be seeing increases in prices (especially in the townhome type) should these number remain.
The current months of inventory (MOI) are quite low and break down as follows:
Apartments – 3.4 MOI
Townhomes – 1.6 MOI
Houses – 1.9 MOI
The reasons that months of inventory are important are that when there is are low months of inventory it will better show the type of market for each selected type of property. The lower the MOI the less likely a seller will need to negotiate.
An average MOI between 5 and 6 months is considered a balanced market. Below 5 months is a seller’s market and above 6 is a buyer’s market. Needless to say you can see that we are in a seller’s market and most definitely in one for both townhomes and detached houses respectively.
Benchmarks prices from November held to relatively modest increases and were as follows:
Apartments – Unchanged
Townhouses – Down 0.1%
Houses – 1.0%
The take away:
We are having quite a bit of low inventory which usually results in upward pressure on prices. Now many think “oh I am looking for an apartment so what do I care about what a house or a townhouse market is doing?”
The housing market is in fact related to each other in the sense that if a purchaser is looking for a 2 bedroom townhouse for instance and they are in fierce competition for that and getting pushed out of the market, they will start to look towards 2 bedroom apartments as they will likely be a bigger fish in a smaller pond as far as available resources to purchase. This in turn will affect the apartment market.
With the currently low interest rates, low inventory and typically a busier market in the spring, predictions of price increases I don’t believe are farfetched. Time will tell and with the BC Real Estate Association forecasting a 2.6% increase, they may not be out of line. Time of course will tell…
If you would like a more targeted analysis for your particular area or needs, please feel free to contact me via phone at 604-522-4777 or e-mail directly at haze-hartwig@coldwellbanker.ca or join us at our Facebook Page (www.facebook.com/HazeRealty)
Source: Real Estate Board of Greater Vancouver – Nov 2020 Stats (http://members.rebgv.org/news/REBGV-Stats-Pkg-December-2020.pdf)