
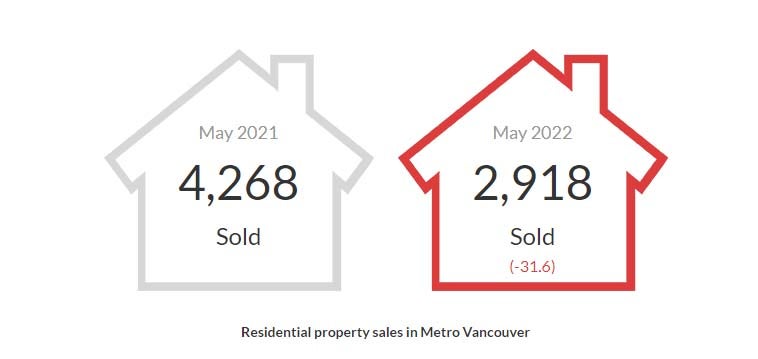
Residential home sales in the Greater Vancouver area reached a total of 2,918 for May of this year, which is a 31.6% decrease from the total sales for May 2021 and a 9.7% decrease from April 2022.
“With interest rates rising, home buyers are taking more time to make their decisions in today’s housing market,” said Daniel John, REBGV Chair. “Home buyers have been operating in a frenzied environment for much of the past two years. This spring is providing a calmer environment, with fewer multiple offer situations, which is allowing buyers to explore their housing options, understand the changing mortgage market, and do their due diligence.”
For May 2022, there was a total of 6,377 homes newly listed across all types (detached, attached and apartments). This is a 10.5% decrease from the number of homes listed in May of last year and a 4.4% increase from April 2022.
Currently the total number of homes listed for Metro Vancouver is 10,010. This is an 8.8% decrease from May of last year and a 13.85 increase from April of this year.
Analysts generally state that downward pressure on home prices occurs when the sales-to-active ratio moves below 12% for a sustained period, while prices of homes will often have upward pressure when it surpasses 20% over a sustained period.
“Upward pressure on home prices has begun to ease in the housing market over the last two months,” Daniel John, REBGV Chair said. “Where home prices go next will depend on housing supply. While we’re beginning to see modest increases in home listings, we still need housing supply totals to more than double to bring the market close to balanced territory.”
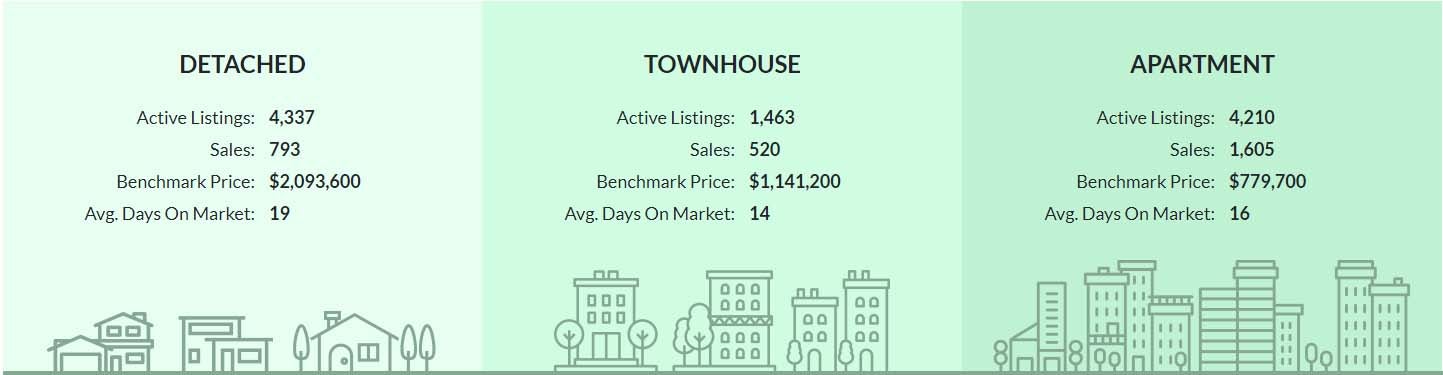
Total sales of homes for May combined were 2,918 with a breakdown as follows:
Detached: 793 with a benchmark price of $2,093,600, which is a 15% increase to the benchmark from May of last year and a 0.4% decrease from April of this year.
Attached: 520 with a benchmark price of $1,141,200, which is a 21.5% increase from the benchmark price in May 2021 and a 0.6% decrease from April 2022
Apartment: 1605 with a benchmark price of $779,700, which is a 15% increase from May of last year and a 0.4% increase from April 2022
THE TAKE AWAY:
While we are on the way to a correction (which is different than a “bubble burst”) we will see a slowing in the market, which is already underway. We can expect that the market will slow down even more after June as there is a traditional slowing in the summer months when children are out of school and people are thinking more about vacations and the like. This year we will most likely see a higher than usual slowing as many people are “covid spite travelling” since restrictions are lifting and people are yearning for the vacations that they have not been able to take pre-pandemic. One of the most blatant indicators of this is how the airports are backlogged getting people through as they were not prepared for so much travel.
This slowing of the market will likely make for some stronger negotiation and thus some deals to be had out there (if you are still in town) as during the summer months, sellers, buyers, realtors all tend to travel more and thus there are just not as many people around to do real estate transactions. This coupled with rising interest rates; with more raises likely on the way will have a cooling effect on the market and will likely create some downward pressure on prices. Another aspect that may create more room for negotiation on pricing is the false sense that “the end is here and we are going to have a market crash”, since the phone is not ringing off the hook. After the 2 years of unheard of, record breaking activity, people have been conditioned that the market moves at this breakneck speed… Let’s take a quick look at this for May as an example:
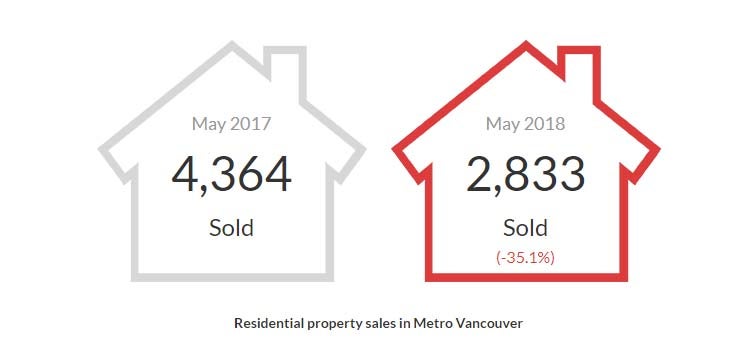
May 2018:
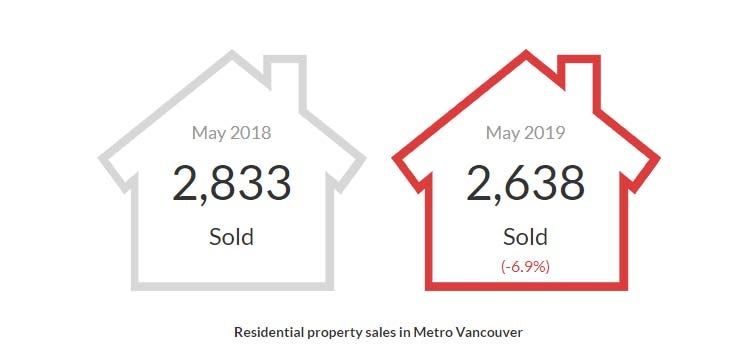
May 2019 (Pre-pandemic):
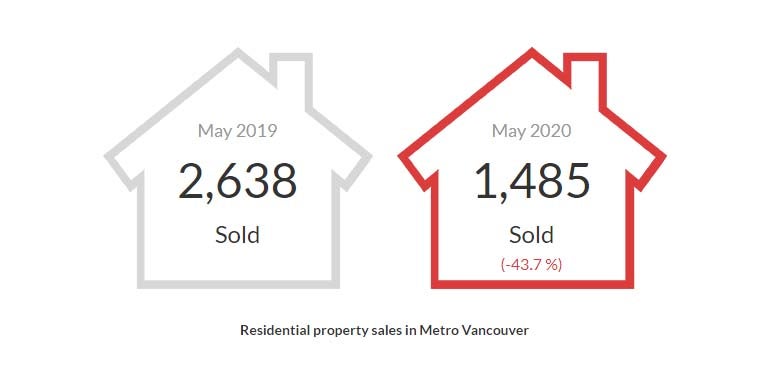
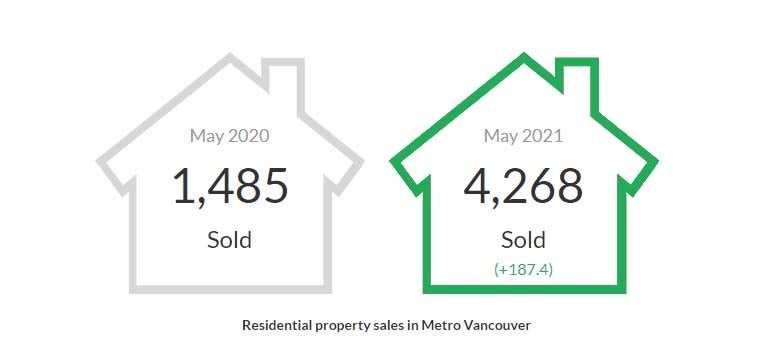
May 2020 (2 Months into Covid, real estate stopped dead):
May 2021 (Covid buying rush):
May 2022 (current):
As you can see from the pre-pandemic purchasing to post pandemic full restrictions, Greater Vancouver is returning to its more traditional numbers for sales.
May 2018: 2,833 - May 2019: 2,638 - May 2022: 2,918 (Average: 2,796)
Yes, relative to what we saw of the past year and change it seems like a heavy slow down, but we are essentially where the numbers usually were for the season since 2018. Outside of the quite unusual circumstances, like a global pandemic.
If you would like a more targeted analysis for your particular area or needs, please feel free to contact me via phone at 604-522-4777 or e-mail directly at: haze@hazerealty.com or join us at our Facebook Page (www.facebook.com/HazeRealty)
(Source: http://members.rebgv.org/news/REBGV-Stats-Pkg-May-2022.pdf)